Colourful data visualisations
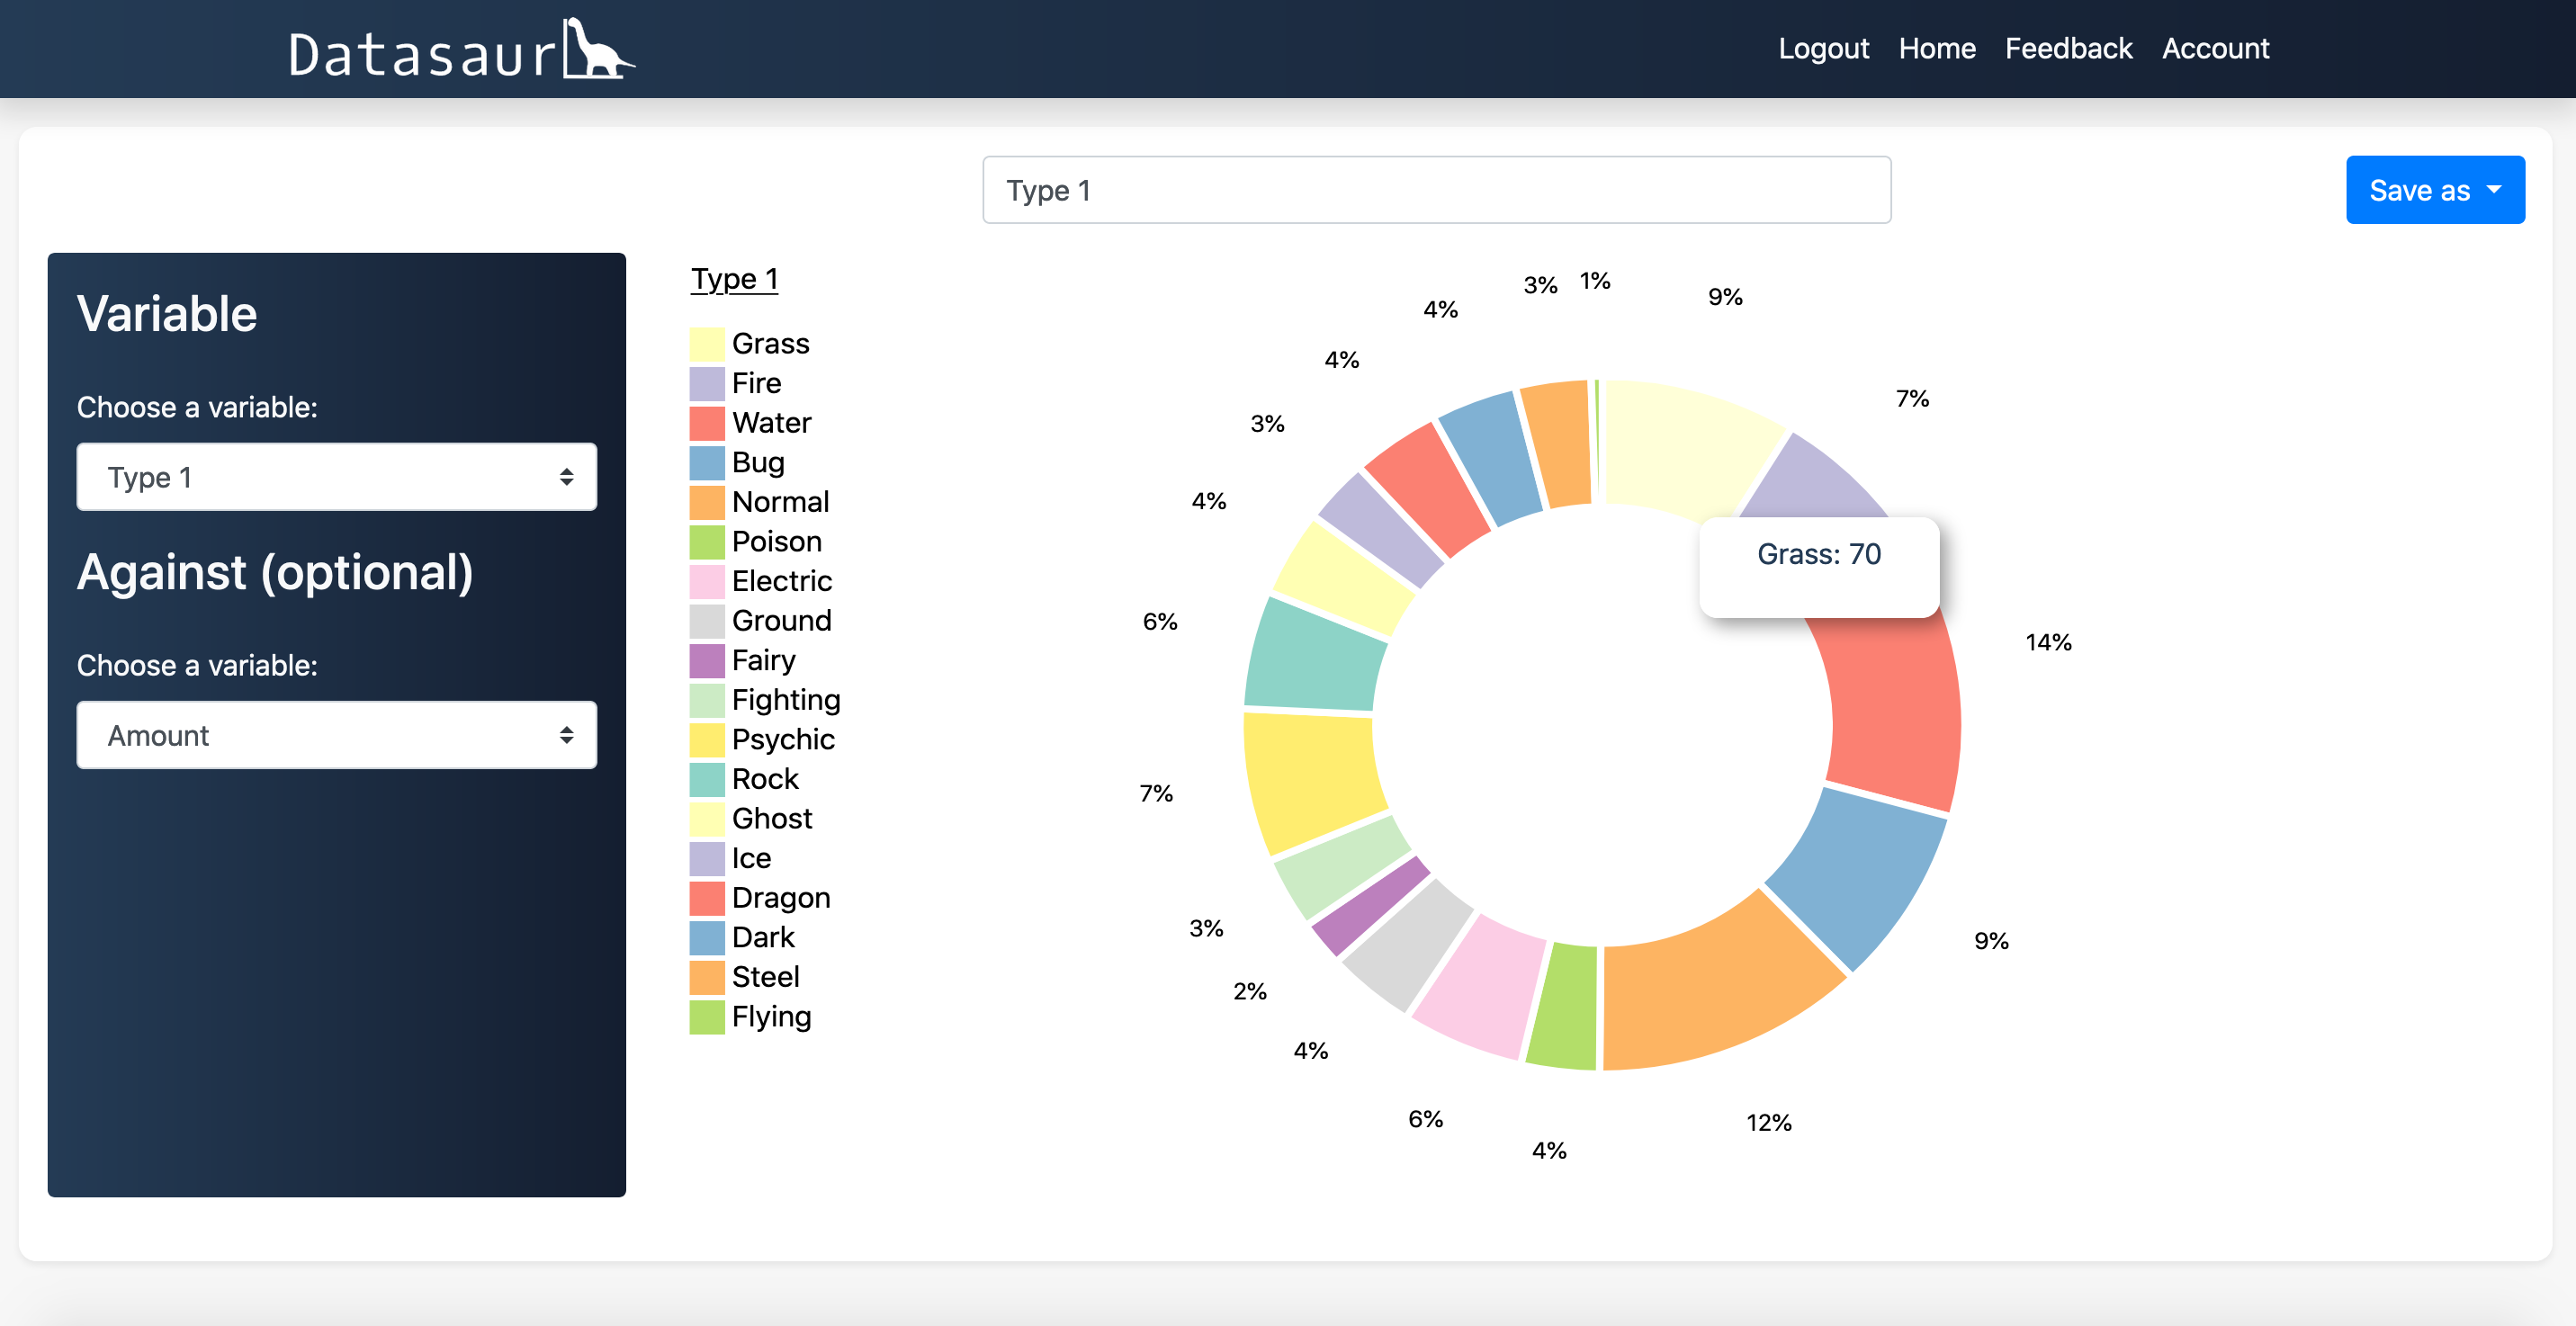
Creating graphical visualisations is easy and stress free, allowing you to quickly derive meaning from your data. Select from a variety of different graph types and create stunning data visualisations in just a few clicks. Save your graphs to your dashboard for later viewing and editing or simply export your finished graph to your device.


