Datasaur Logo

Making survey analysis easy

Already have an account? Login

Colourful data visualisations

Creating graphical visualisations is easy and stress free, allowing you to quickly derive meaning from your data. Select from a variety of different graph types and create stunning data visualisations in just a few clicks. Save your graphs to your dashboard for later viewing and editing or simply export your finished graph to your device.
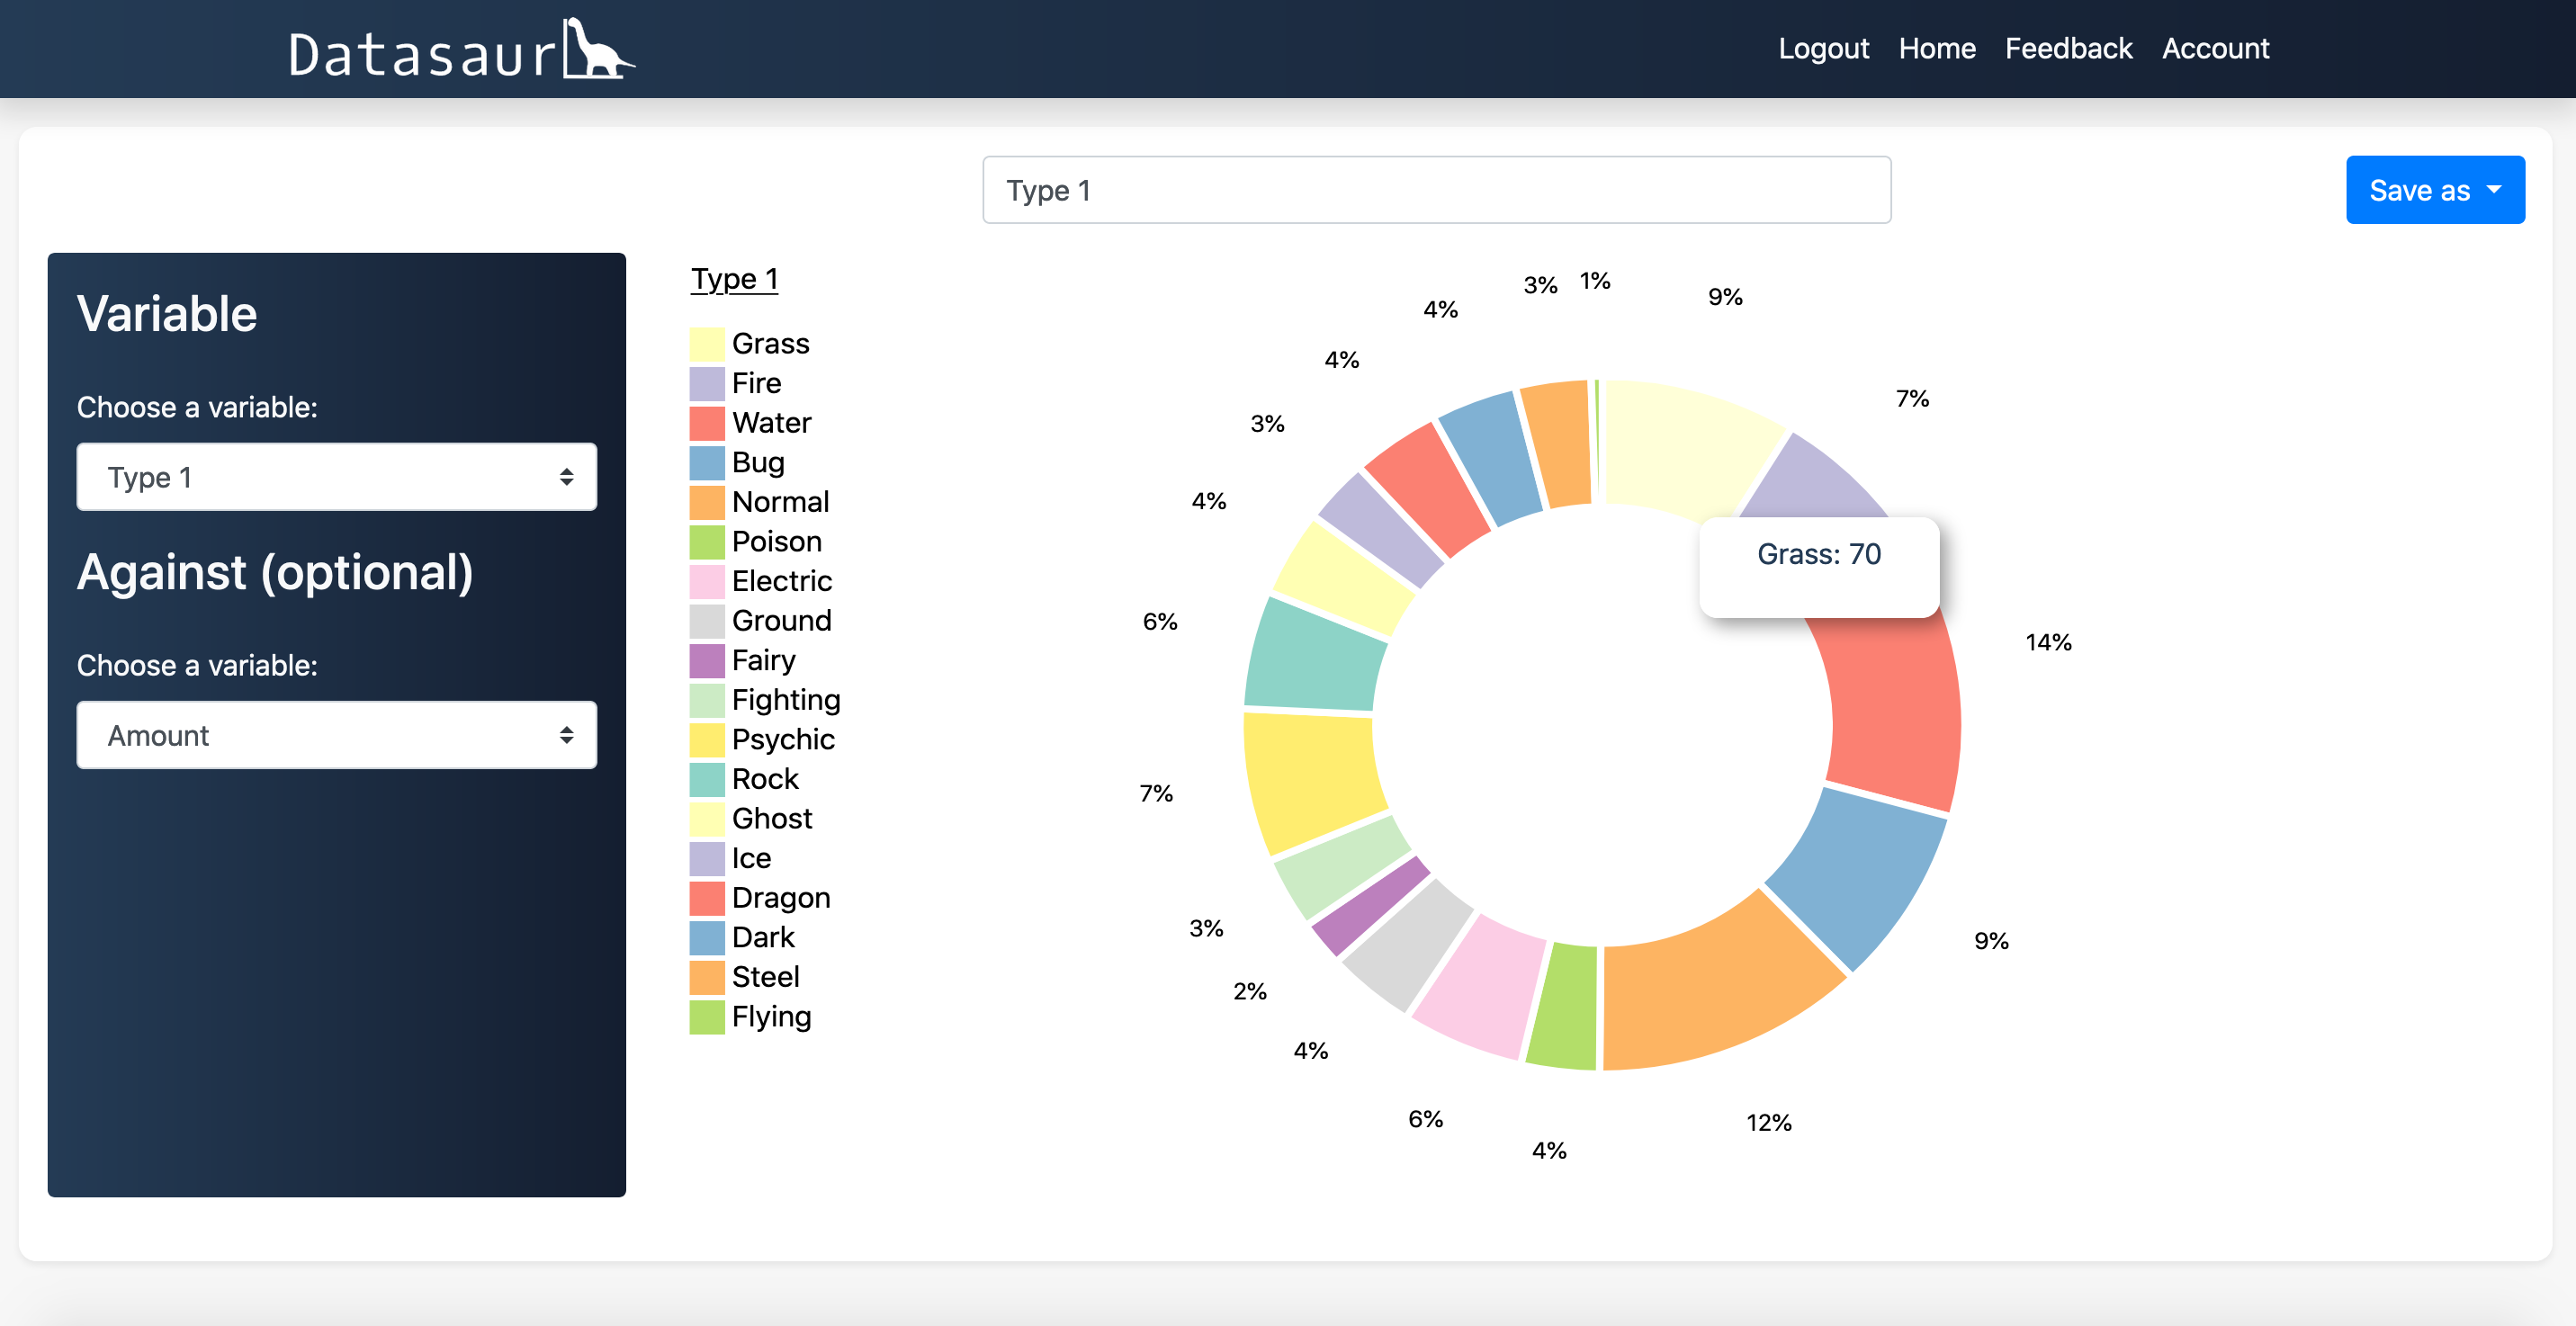
pie-chart image
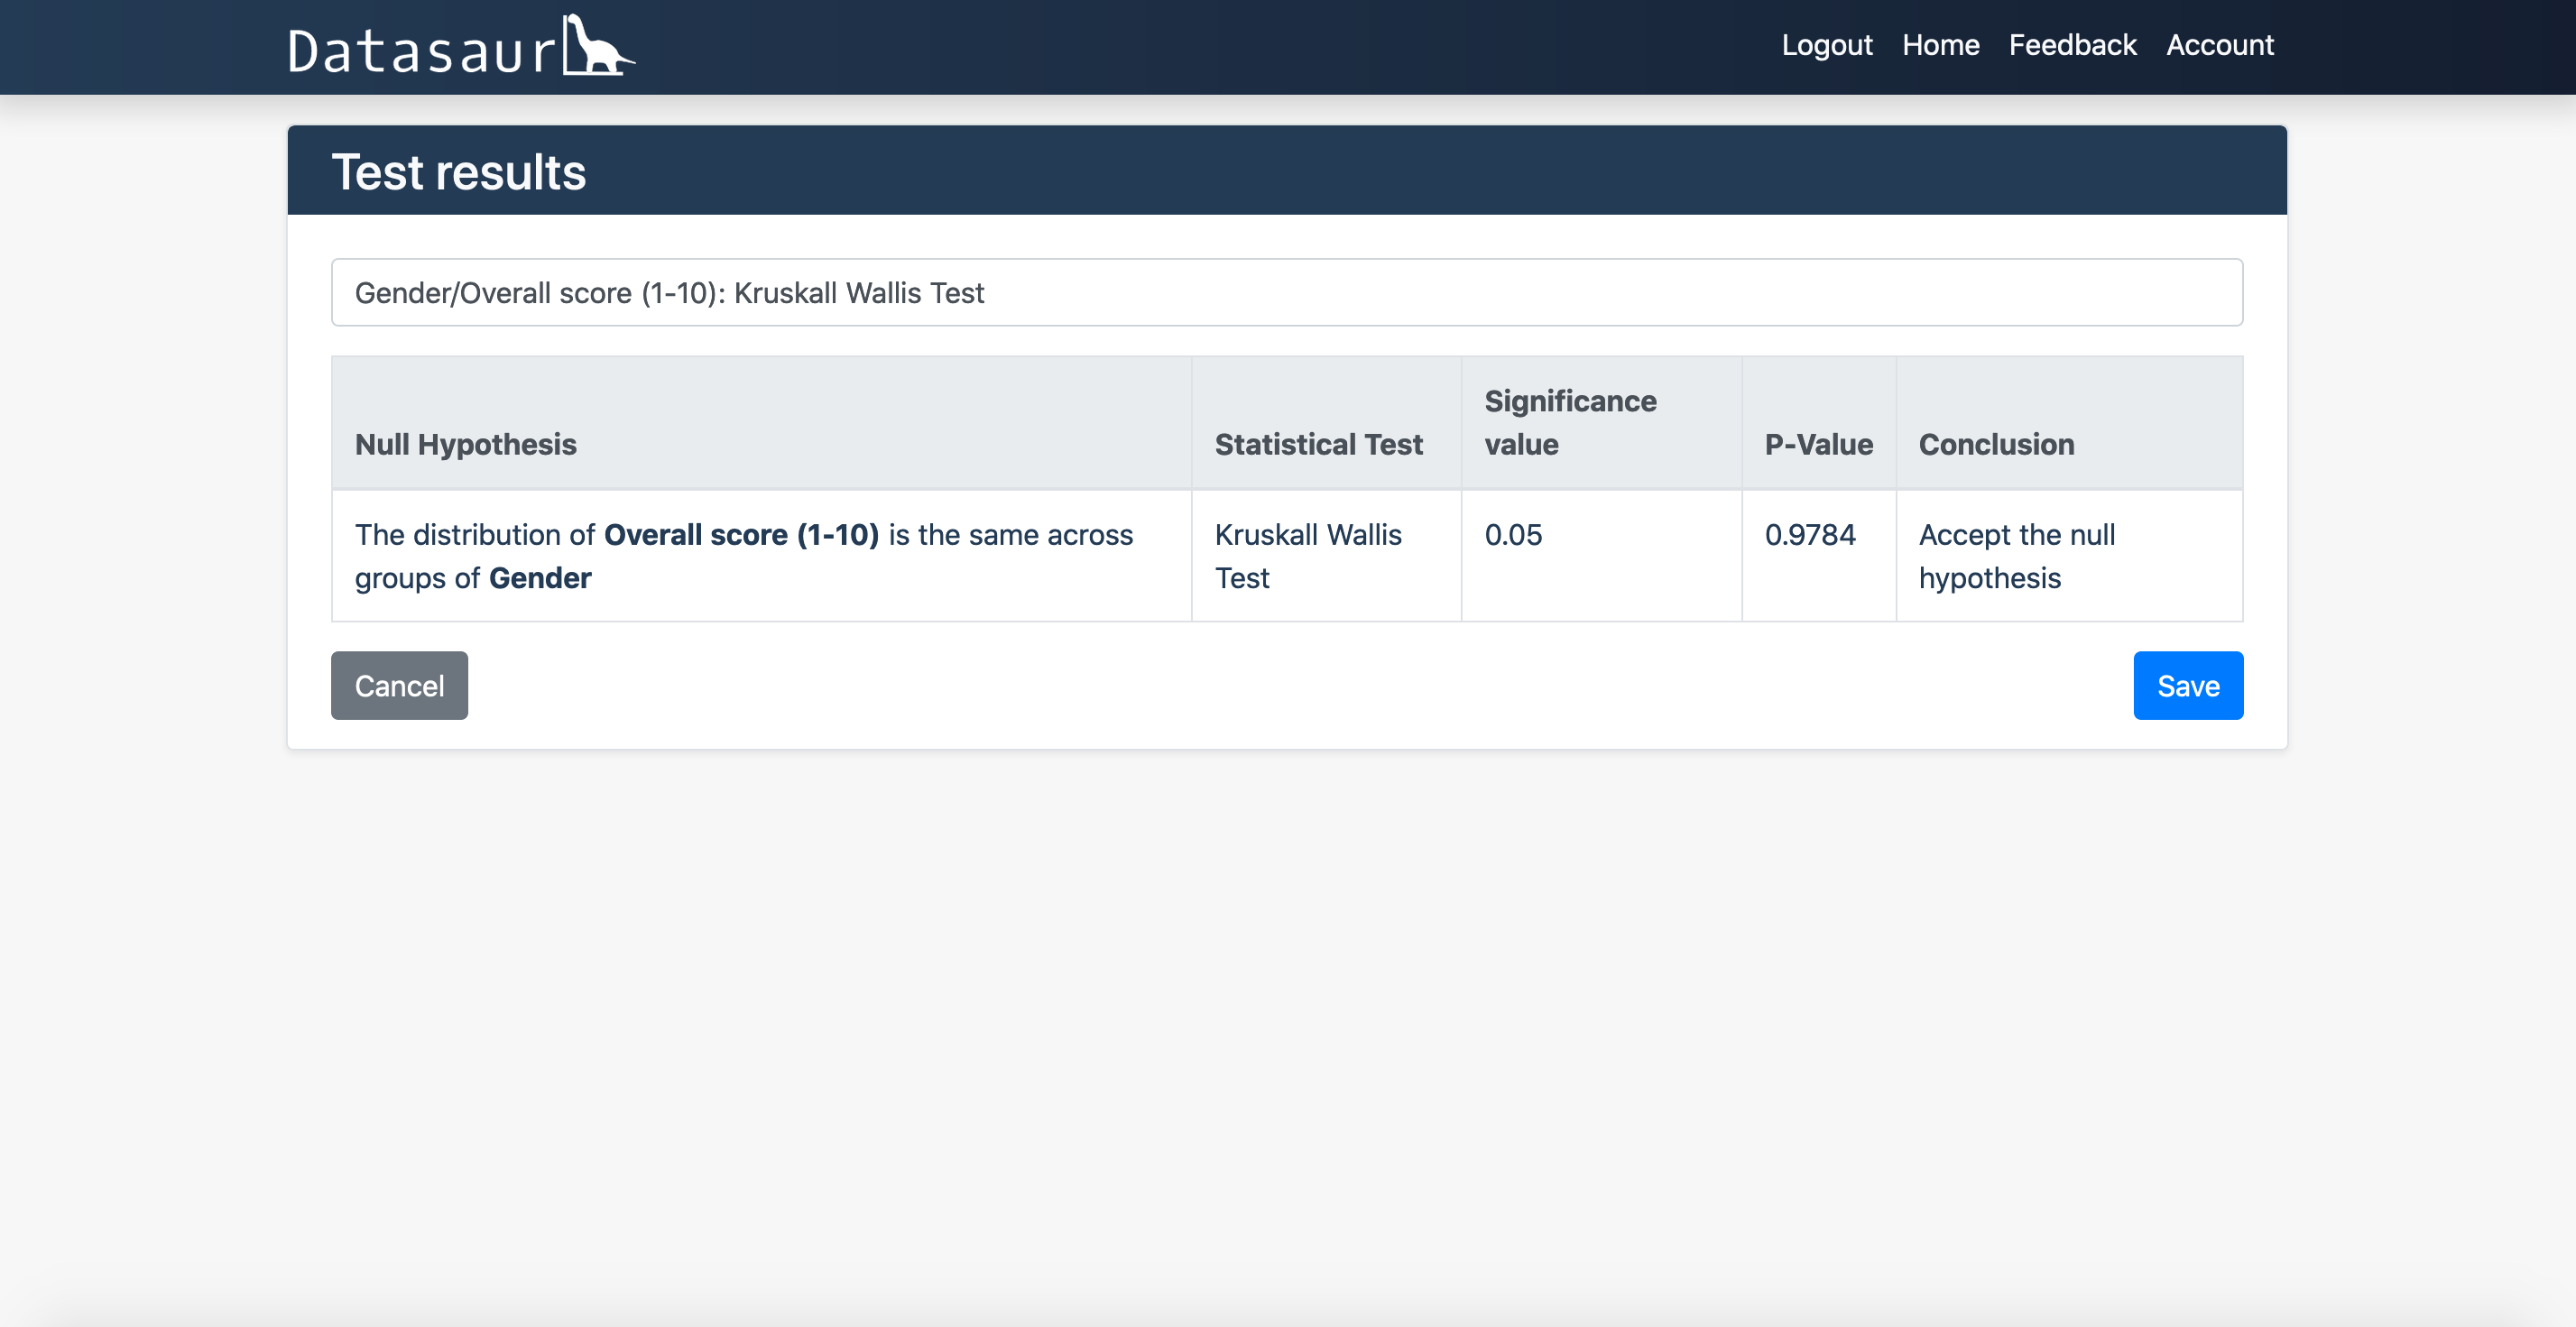
Image of kruskal wallis test

Quick analysis

Analysing data can be a daunting task. With our tools, it is easy to quickly discover any significant findings in your data by carrying out statistical tests. We will automatically run a series of tests on your data when you upload your file and alert you of any significant findings. You can also carry out specific tests of your choosing and we will quickly generate p-values, suggest null hypotheses and advise whether to reject or accept the null hypothesis.

Easy data editing

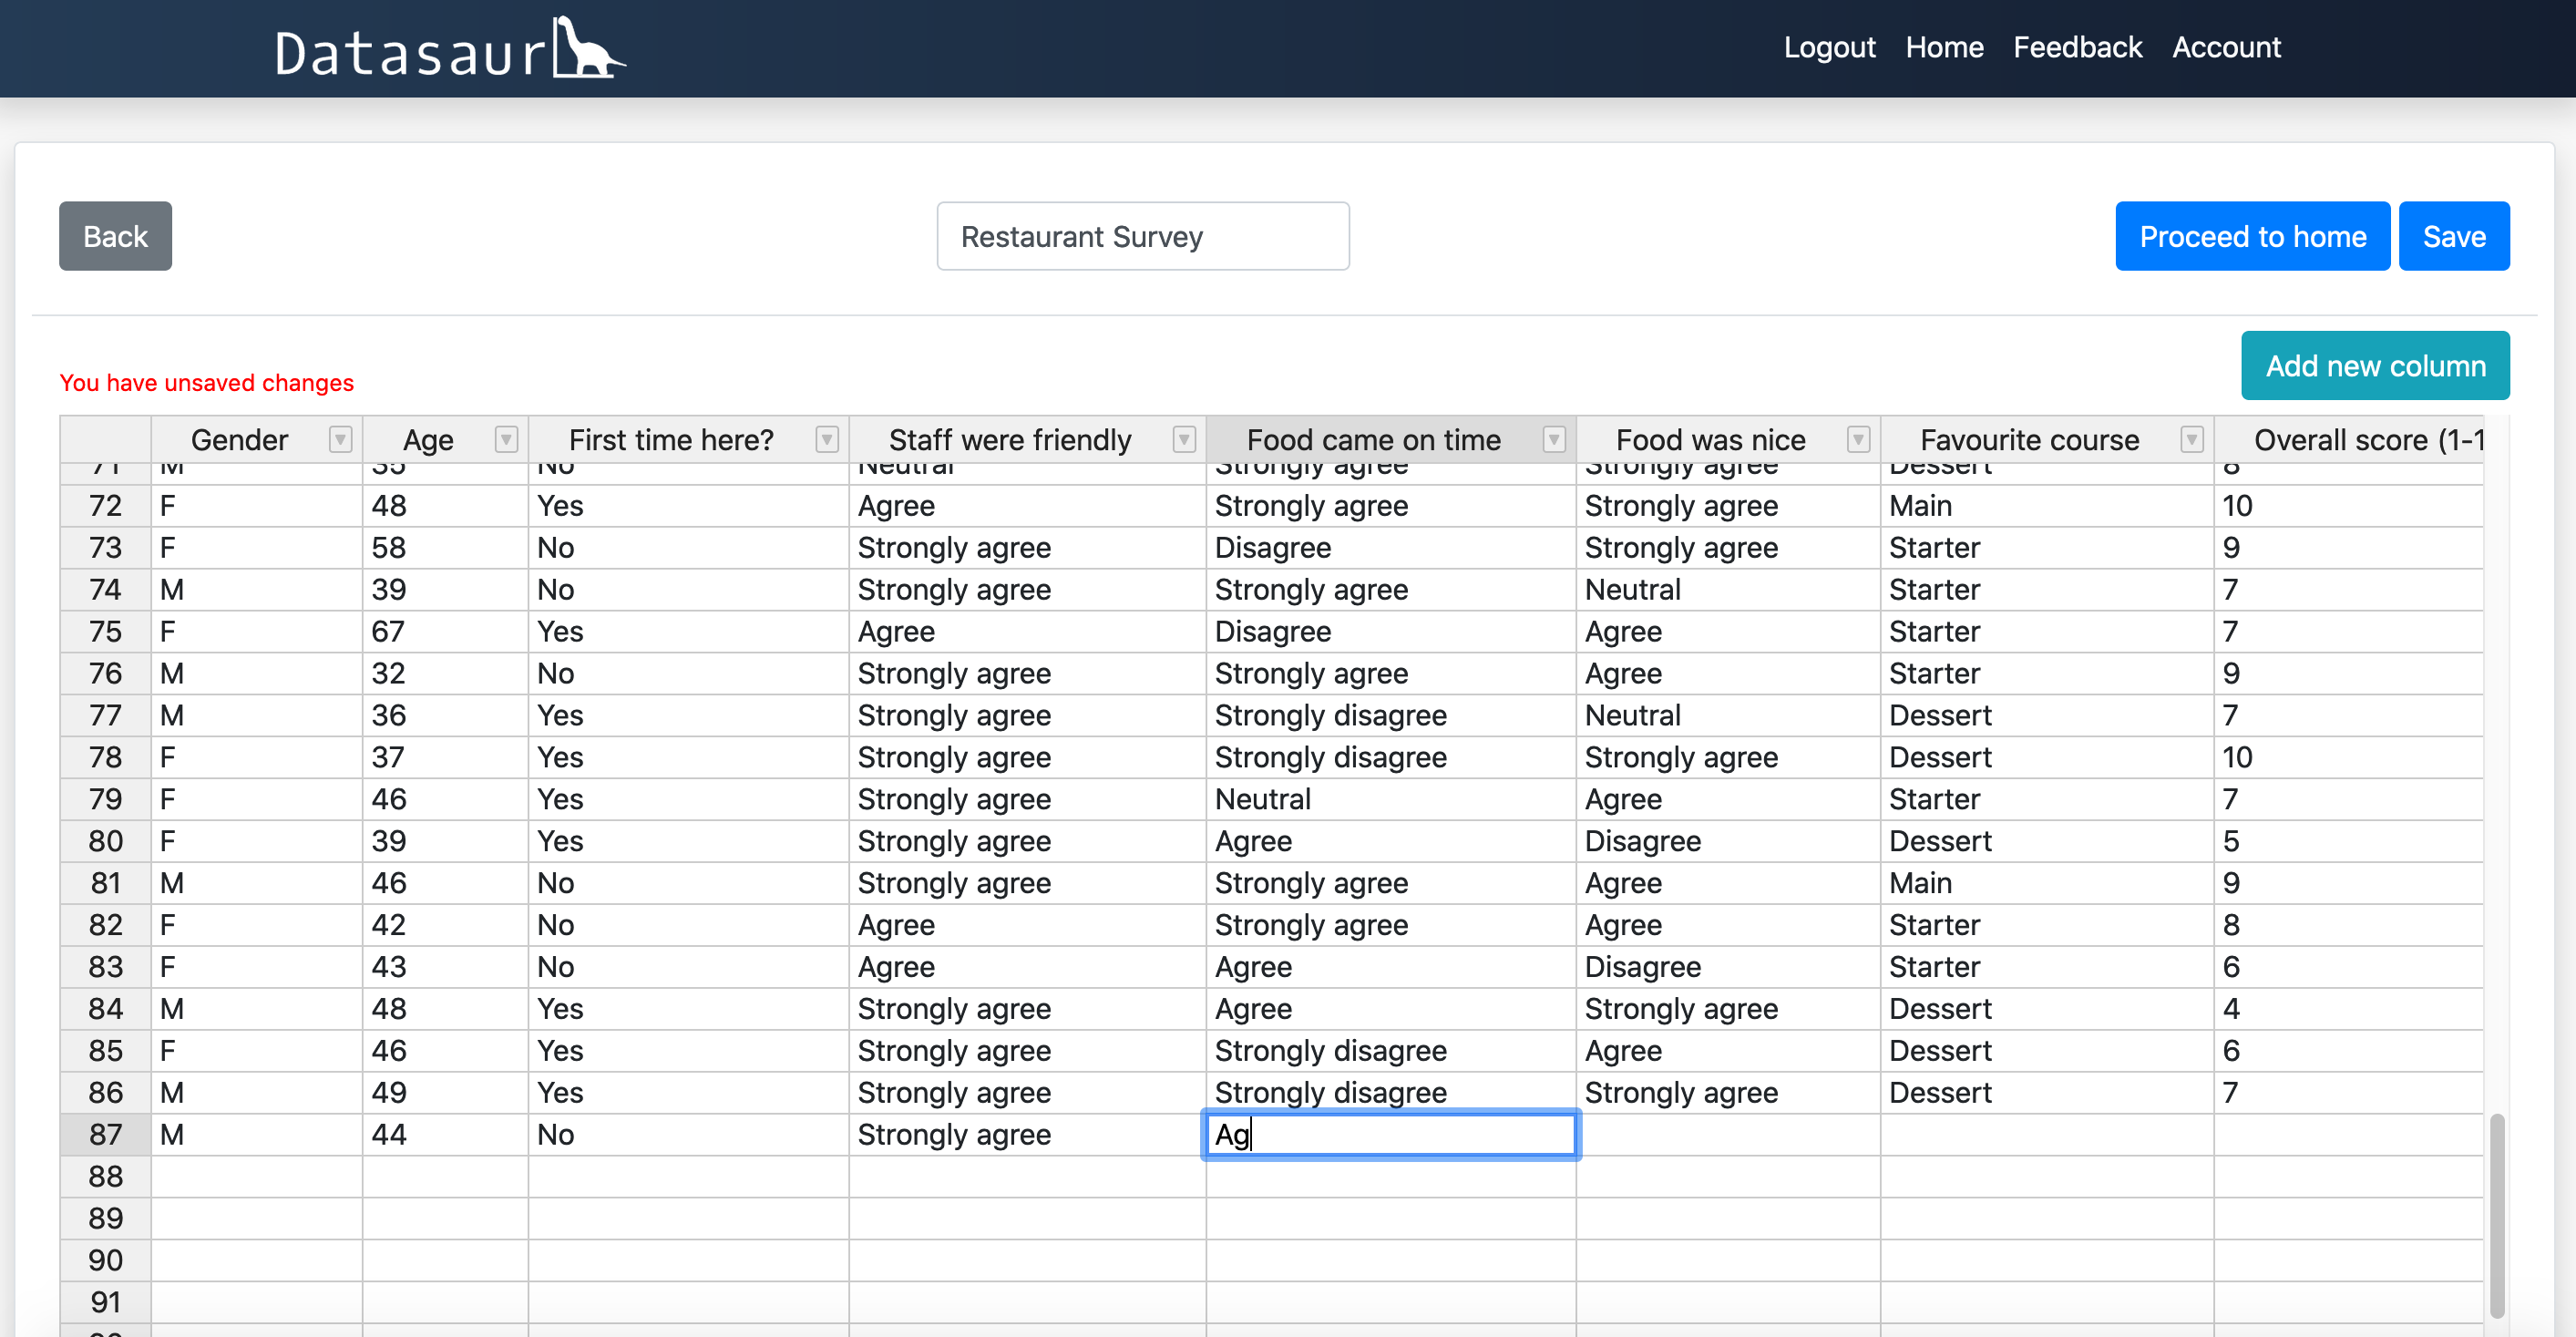
Image of data in a table

Edit your imported CSV and Excel files, or simply enter your data manually from scratch

Datasaur is totally free!

  • Unlimited surveys...
  • Unlimited statistical tests...
  • Unlimited graphs...